







Design / interiors
@marina_uiux
331 267
1 341
797 700
Instagram niche insights
Benchmarks based on 101 public English Design / interiors profiles and 1 010 mature posts.
Data updated November 18, 2026
| Metric | 25% | Median | 75% |
|---|---|---|---|
| Likes | 42 | 120 | 505 |
| Comments | 2 | 7 | 21 |
| Engagement rate | 0.7% | 1.2% | 3.0% |
| Caption length | 138 | 264 | 457 |
| Hashtags | 0 | 5 | 7 |
Weekday with the strongest median engagement
SundayContent roles
Popular hashtags
Explore profile metrics, niche comparisons, and practical growth recommendations.
Recent videos with a strong audience response.




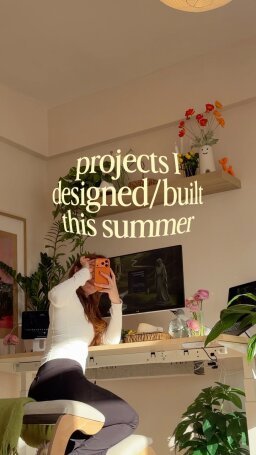


This benchmark uses 101 public profiles and 1 010 posts. Values are medians and percentile ranges, so unusually large accounts have less influence.
Don’t miss your chance to unlock powerful analytics and personal insights for your Instagram.